
Filter by
The language used throughout the course, in both instruction and assessments.
Results for "heat maps"
Coursera Project Network
Skills you'll gain: Javascript
University of Toronto
Skills you'll gain: ArcGIS, GIS Software, Spatial Data Analysis, Geographic Information Systems, Geospatial Information and Technology, Geospatial Mapping, Data Mapping, Data Collection

University of Colorado Boulder
Skills you'll gain: Embedded Systems, Electronic Hardware, Embedded Software, Hardware Design, Electronic Components, Electrical Engineering, Thermal Management, Display Devices, Debugging, Schematic Diagrams, Development Environment

Johns Hopkins University
Skills you'll gain: Rmarkdown, Shiny (R Package), Ggplot2, Tidyverse (R Package), Data Visualization, Spatial Data Analysis, Scatter Plots, Plot (Graphics), Dashboard, Data Import/Export, Data Visualization Software, Interactive Data Visualization, R Programming, Geospatial Information and Technology, Statistical Reporting, Plotly, Statistical Visualization, Data Storytelling, Heat Maps, Data Manipulation
Skills you'll gain: Data Storytelling, Data Presentation, Data Visualization, Interactive Data Visualization, Big Data, Data Visualization Software, Data Analysis, IBM Cognos Analytics, Statistical Analysis, Data Mining, Dashboard, Apache Hadoop, Data Collection, Tree Maps, Excel Formulas, Apache Hive, Microsoft Excel, Data Quality, Data Cleansing, Data Import/Export
Sciences Po
Skills you'll gain: International Relations, Cultural Diversity, Social Sciences, Demography, Environmental Issue, Sociology, Social Justice, Political Sciences, Policty Analysis, Research, and Development, Governance, Law, Regulation, and Compliance, Public Policies, Economics

Tableau Learning Partner
Skills you'll gain: Data Visualization Software, Spatial Data Analysis, Tableau Software, Data Storytelling, Interactive Data Visualization, Geospatial Information and Technology, Stakeholder Communications, Geospatial Mapping, Business Reporting, Business Analytics, Business Intelligence
University of Toronto
Skills you'll gain: ArcGIS, Data Visualization, Geovisualization, Spatial Analysis, Spatial Data Analysis

Skills you'll gain: Data Mining, Dashboard, Data Collection, Microsoft Excel, Data Quality, Data Cleansing, Data Analysis, Data Visualization Software, Spreadsheet Software, IBM Cognos Analytics, Exploratory Data Analysis, Pivot Tables And Charts, Data Wrangling

Skills you'll gain: Data Storytelling, Marketing Automation, Web Analytics, Marketing Effectiveness, Marketing Analytics, Customer Insights, Digital Marketing, Market Analysis, Google Analytics, Social Media Marketing, Customer Analysis, Search Engine Marketing, Advertising Campaigns, Marketing Strategies, Social Media Strategy, Performance Reporting, Search Engine Optimization, Marketing Planning, Predictive Analytics, MarTech

University of Toronto
Skills you'll gain: Geographic Information Systems, Geospatial Mapping, Data Mapping, Spatial Data Analysis, Data Visualization, Metadata Management, Quantitative Research, Typography, Data Cleansing, Data Validation, Design Elements And Principles, Data Integration
Skills you'll gain: Engineering Analysis, Thermal Management, Hydraulics, Mechanical Engineering, Simulations, Numerical Analysis, Mathematical Modeling, Engineering, Scientific Visualization, Physics, Test Case
In summary, here are 10 of our most popular heat maps courses
- Real-time data visualization dashboard using Node-red: Coursera Project Network
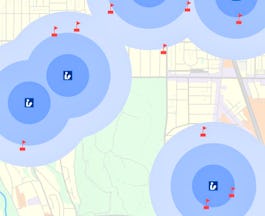
- Introduction to GIS Mapping: University of Toronto
- Sensors and Sensor Circuit Design: University of Colorado Boulder
- Data Visualization & Dashboarding with R: Johns Hopkins University
- Data Analysis and Visualization Foundations: IBM
- International migrations: a global issue: Sciences Po
- Advanced Data Visualization with Tableau: Tableau Learning Partner
- GIS, Mapping, and Spatial Analysis Capstone: University of Toronto
- Assessment for Data Analysis and Visualization Foundations: IBM
- Unilever Digital Marketing Analyst: Unilever


