
Filter by
The language used throughout the course, in both instruction and assessments.
Results for "plot (graphics)"
Coursera Project Network
Skills you'll gain: Data Analysis, Data Visualization, Javascript

Coursera Project Network
Skills you'll gain: Plotly, Exploratory Data Analysis, Scatter Plots, Plot (Graphics), Data Visualization Software, Statistical Visualization, Interactive Data Visualization
DeepLearning.AI
Skills you'll gain: Generative AI, PyTorch (Machine Learning Library), Image Analysis, Deep Learning, Artificial Neural Networks, Applied Machine Learning, Data Ethics, Computer Graphics, Machine Learning

University of Michigan
Skills you'll gain: Matplotlib, Network Analysis, Feature Engineering, Plot (Graphics), Data Visualization Software, Interactive Data Visualization, Pandas (Python Package), Applied Machine Learning, Supervised Learning, Text Mining, Scikit Learn (Machine Learning Library), Network Model, Jupyter, NumPy, Graph Theory, Data Manipulation, Natural Language Processing, Data Analysis, Data Processing, Unstructured Data

Coursera Project Network
Skills you'll gain: 3D Modeling, SketchUp (3D Modeling Software), Computer Graphics, Visualization (Computer Graphics), Graphical Tools

University of Toronto
Skills you'll gain: Computer Vision, Image Analysis, Embedded Software, Automation, Deep Learning, Simulation and Simulation Software, Software Architecture, Safety Assurance, Artificial Neural Networks, Global Positioning Systems, Visualization (Computer Graphics), Hardware Architecture, Process Control, Systems Architecture, Graph Theory, Estimation, Algorithms, Artificial Intelligence, Machine Learning Methods, Mathematical Modeling

Coursera Project Network
Skills you'll gain: Microsoft Excel

Coursera Project Network
Skills you'll gain: Data Visualization, Microsoft Excel, Data Visualization Software, Data Import/Export, Business Reporting, Microsoft 365, User Accounts
 Status: Free
Northwestern University
Skills you'll gain: Image Analysis, Digital Communications, Computer Vision, Visualization (Computer Graphics), Electrical Engineering, Matlab, Color Theory, Applied Mathematics, Statistical Process Controls
Coursera Project Network
Skills you'll gain: Research and Design, Visual Design

Duke University
Skills you'll gain: Presentations, Data Storytelling, Data Presentation, Data Visualization, Interactive Data Visualization, Tableau Software, Dashboard, Data Visualization Software, Business Analytics, Business Analysis, Data Analysis, Trend Analysis, Stakeholder Communications

Coursera Project Network
Skills you'll gain: Microsoft Excel, Data Visualization Software, Spreadsheet Software, Pivot Tables And Charts, Exploratory Data Analysis, Data Analysis Software
In summary, here are 10 of our most popular plot (graphics) courses
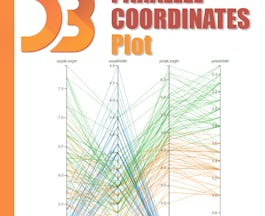
- Simple Parallel Coordinates Plot using d3 js: Coursera Project Network
- Data Visualization using Plotly: Coursera Project Network
- Build Basic Generative Adversarial Networks (GANs): DeepLearning.AI
- Applied Data Science with Python: University of Michigan
- SketchUp: how to start modelling simple 3D objects: Coursera Project Network
- Self-Driving Cars: University of Toronto
- Crear Gráficos y Paneles con Microsoft Excel: Coursera Project Network
- Data Visualization using Microsoft Excel: Coursera Project Network
- Fundamentals of Digital Image and Video Processing: Northwestern University
- Create an Infographic in Canva: Coursera Project Network


