
Filter by
The language used throughout the course, in both instruction and assessments.
Results for "plot (graphics)"

University of Colorado Boulder
Coursera Project Network
Skills you'll gain: Data Analysis, Process Analysis, R Programming

Coursera Project Network
Skills you'll gain: Storyboarding, Storytelling, Functional Design, Content Creation, User Story, Visualization (Computer Graphics), Digital Publishing
Coursera Project Network
Skills you'll gain: Data Analysis, Process Analysis, R Programming

Skills you'll gain: Graphic Design, Adobe Photoshop, Graphic and Visual Design, Visual Design, Design, Logo Design, Content Creation, Typography, Creativity, Color Theory, User Experience Design, Advertising

École Polytechnique Fédérale de Lausanne
Skills you'll gain: Spatial Analysis

Johns Hopkins University

Vanderbilt University
Skills you'll gain: Data Storytelling, Statistical Methods, Regression Analysis, Generative AI, Statistical Analysis, Data-Driven Decision-Making, Technical Communication, Data Visualization, Probability & Statistics, Data Analysis, Exploratory Data Analysis, Descriptive Statistics, Statistical Hypothesis Testing, Predictive Analytics, Box Plots, Data Visualization Software, Analytical Skills, Artificial Intelligence, Forecasting, Histogram

University of Michigan
Skills you'll gain: Computational Thinking, Python Programming
Coursera Project Network
Skills you'll gain: Keras (Neural Network Library), Image Analysis, Data Processing, Data Manipulation, Visualization (Computer Graphics), Computer Vision, Deep Learning, Python Programming, Machine Learning

University of Minnesota
Skills you'll gain: Data Analysis, Data Visualization

Skills you'll gain: Typography, Graphic and Visual Design, Graphic Design, Visual Design, Digital Design, Adobe Photoshop, Adobe Illustrator, Design, Design Reviews, Storytelling, User Centered Design, Color Theory
In summary, here are 10 of our most popular plot (graphics) courses
- William Shakespeare's Romeo & Juliet: An Actor's Perspective: University of Colorado Boulder
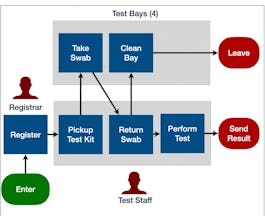
- Simulation of Covid-19 Testing Process Using R Simmer: Coursera Project Network
- Crea juegos e historias animadas con Scratch: Coursera Project Network
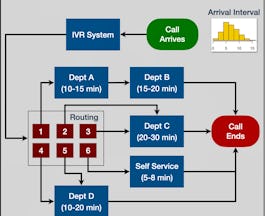
- Simulation of Call Centre Operations Using R Simmer: Coursera Project Network
- Ultimate Graphic Design Course: Create 40 Practical Projects: Packt
- Geographical Information Systems - Part 2: École Polytechnique Fédérale de Lausanne
- Advanced Techniques in Data Visualization: Johns Hopkins University
- From Data To Decision With AI: Vanderbilt University
- Python Fundamentals for Designers: University of Michigan
- Build a Machine Learning Image Classifier with Python: Coursera Project Network


